| System: | www.glorb.com in Glorb |
| Maintainer: | Geoff Brozny |
| Processor Load MIB: | .1.3.6.1.2.1.25.3.3.1.2.1 |
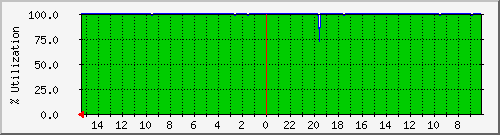
| Max Load: | 100.0 % (0.0%) | Average Load: | 100.0 % (0.0%) | Current Load: | 100.0 % (0.0%) | ||
| Max Load: | 100.0 % (0.0%) | Average Load: | 100.0 % (0.0%) | Current Load: | 100.0 % (0.0%) |
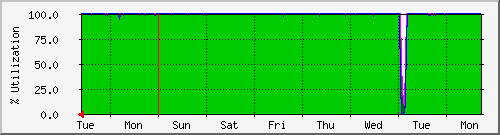
| Max Load: | 100.0 % (0.0%) | Average Load: | 99.0 % (0.0%) | Current Load: | 100.0 % (0.0%) | ||
| Max Load: | 100.0 % (0.0%) | Average Load: | 99.0 % (0.0%) | Current Load: | 100.0 % (0.0%) |
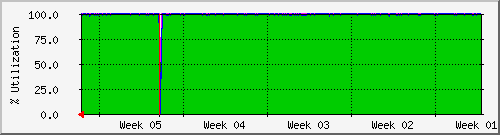
| Max Load: | 100.0 % (0.0%) | Average Load: | 99.0 % (0.0%) | Current Load: | 100.0 % (0.0%) | ||
| Max Load: | 100.0 % (0.0%) | Average Load: | 99.0 % (0.0%) | Current Load: | 100.0 % (0.0%) |
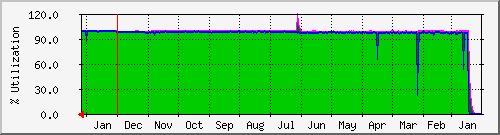
| Max Load: | 120.0 % (0.0%) | Average Load: | 95.0 % (0.0%) | Current Load: | 100.0 % (0.0%) | ||
| Max Load: | 120.0 % (0.0%) | Average Load: | 95.0 % (0.0%) | Current Load: | 100.0 % (0.0%) |
| GREEN ### | Proc Load in next minute |
| BLUE ### | Proc Load in next minute |
| DARK GREEN### | Maximal 5 Minute Proc Load |
| MAGENTA### | Maximal 5 Minute Proc Load |
| 2.9.29 | Tobias Oetiker <oetiker@ee.ethz.ch> and Dave Rand <dlr@bungi.com> |